異常に奥が深いnumpyで遊びましょう!!
import numpy as np
配列の形状変換
a = np.arange(int(np.floor(np.random.rand()*1000)))
for i in range(1,len(a)+1):
     if len(a) % i == 0:
             np.reshape(a, (i,-1))
速度測定
def test(n):
    return sum(range(n))

import timeit
timeit.timeit('test(100)', globals=globals(), number=1000)
amaxとmaxの比較
>>> timeit.timeit('np.amax(a)', globals=globals(), number=1000000)
3.069760522001161
>>> timeit.timeit('np.max(a)', globals=globals(), number=1000000)
3.094179121999332
環境と調子次第で0.3s(10%)くらい変動するのが気になる。
whereの楽しい使い方
a = np.arange(12).reshape((3, 4))
b = np.reshape(a, (3, 4))
c = b ** 2
np.where(b % 2 == 0, b, c) # bが偶数でないときはcが出てくる
TransposeとTを科学する
a = np.arange(120).reshape((1,2,3,4,5))
# a.T = a.transpose(4,3,2,1,0)
b = np.arange(120).reshape((2,3,4,5))
# b.T = b.transpose(3,2,1,0)
c = np.arange(24).reshape((2,3,4))
# c.T = c.transpose(2,1,0)
位置関係が逆転する訳だ
楽しい図形描写
import matplotlib.pyplot as plt
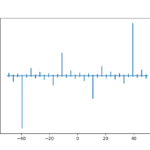
x = np.linspace(-50, 50, 100000)
y = np.tan(x)
plt.plot(x, y)
plt.show()
from scipy.special import expit
x = np.linspace(-10, 10, 100000)
y = expit(x)
plt.plot(x, y)
plt.show()
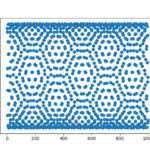
x = np.random.randint(1000, size = 10000)
y = np.sin(x)
plt.scatter(x, y)
plt.show()

謎の模様・・・なぜだ?自己組織化に関連しているような・・・。
import numpy as np
import matplotlib.pyplot as plt
for i in range(1, 20):
  n = i * 100
  x = np.random.randint(n, size = 10000)
  y = np.sin(x)
  plt.scatter(x, y)
  plt.title("n = " + str(n))
  plt.show()
やばい(ヤバい)
import numpy as np
import matplotlib.pyplot as plt
for i in range(1, 20):
n = i * 100
x = np.random.randint(n, size = 10000)
y = np.sin(x)
plt.scatter(x, y)
plt.title("n = " + str(n))
https://t.co/VN8b2xoiQR() pic.twitter.com/b0vSA0ABzc— R (@R_farms) 2019年2月7日


